North Bethany Real Estate Blog RSS Icon
Found 63 entries about North Bethany Real Estate Blog.

We are often asked if we are in a Buyer’s Market or a Seller’s Market in Sea Colony and this is the time of year when we calculate absorption rates in order to answer that question and understand how the market is trending. We compare the pace of sales over the previous 12 months to determine how many Months Supply of Inventory is for sale.

Generally, a balanced market would have 7 months of inventory while more would be a Buyer’s market and less a Seller’s market. While Sea Colony West continues to stay in a strong Seller’s Market, inventory is growing on the East and we are trending towards a Buyer’s Market.

If you would like to discuss the market in more detail, we are here to help. Please call our Sea Colony Specialists: 


Gail Phelan     
286 Views, 0 Comments
Read Full Post

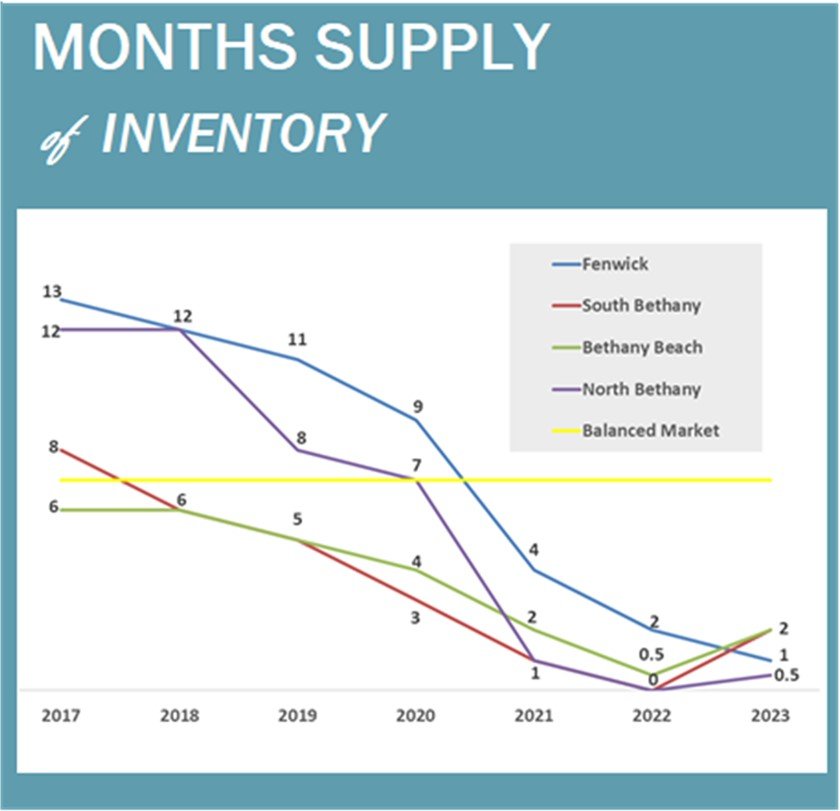
We are often asked if we are in a Buyer’s Market or a Seller’s Market at the beach and this is the time of year when we calculate absorption rates in order to answer that question and understand how the market is trending. We compare the pace of sales over the previous 12 months to determine how many Months Supply of Inventory is for sale.


Generally, a balanced market would have 7 months of inventory while more would be a Buyer’s Market and less a Seller’s Market. The continuation of very limited inventory for sale has kept us in a Seller’s Market from Fenwick Island to North Bethany.        

If you would like to discuss the market in more detail, we are here to help. Please give us a call.

Leslie Kopp                            Christi
558 Views, 0 Comments
Read Full Post

The summer season is well underway, and we’ve enjoyed seeing so many homeowners and vacationers return to the area over the past few weeks!

May was a strong month for real estate sales, with 31 properties going under contract in the Bethany-Fenwick area—up from 18 in May of 2024.As the chart illustrates, year-to-date, both the number of properties under contract and total sales volume are up 10%. For well over a year now, we’ve been noting an upward trend in inventory, and that continues. So far this year, properties are taking about a week longer to go under contract compared to the same time last year.

With the busy summer season upon us, it is a great time to look at homes as a buyer and a great time to list if you are thinking of selling.  

419 Views, 0 Comments
Read Full Post

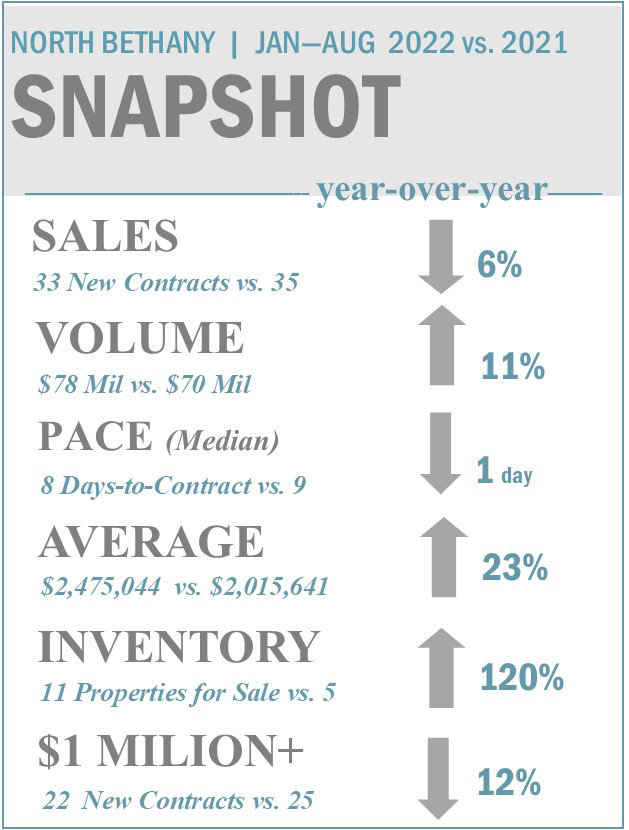
Happy Spring! As we look back on the first 4 months of the year, sales in North Bethany were firm when compared to 2024. However, with 14 properties currently for sale, inventory has nearly tripled in the last year. It is important to note that we are still far below pre-pandemic levels when it was common to have between 30 and 40 properties available for sale in North Bethany.     

As the chart illustrates, sales activity is up 11% so far this year when compared to the first 4 months of 2024 and sales volume down is 4%. Properties are taking longer to sell with 38 days as the median days-to-contract vs. 16 days last year. The median sale price is up 30%. This is reflective of the location and types of properties sold, not necessarily appreciation

233 Views, 0 Comments
Read Full Post


*Data was derived from the Sussex County MLS. Includes properties sold in North Bethany, Bethany Beach, South Bethany & Fenwick Island.
May not reflect all activity in the marketplace.

During the first quarter of 2025, the Bethany-Fenwick real estate market was softer when compared to 2024. Total sales were down 12% (60 vs 68) during the first 3 months when compared to last year. Inventory is growing and properties took 3 weeks longer, on average, to go under contract when compared to the same time last year. The graph above illustrates historic inventory levels on April 1 each year and the median sale price of properties sold in the first quarter. We feel the market shifting, but real estate remains a solid long term investment.

Please give us a

638 Views, 0 Comments
Read Full Post

snapshot of bethany fenwick market update 2025

March has arrived and after a winter with multiple snowstorms in a few short months, we are grateful for warmer, light-filled days ahead!

As the chart illustrates, the Bethany-Fenwick area had a slower start to the year for real estate. Through the first two months of 2025, properties took about 10 days longer to sell and new contracts were down 23% when compared to last year. The most significant reduction in sales was for condo/townhome properties under $500K, which were down 86% (1 vs.7). Therefore, sales volume in dollars, based on list price, declined by a much smaller margin (2%) and the average sale price for properties settled in January and February was up 67% when compared to 2024.

As always, if we can help you with your real estate

642 Views, 0 Comments
Read Full Post

Bethany Fenwick Sellers Market 24

As we head into what is typically an active selling season for beach property, this is a time we like to calculate absorption rates to determine whether we are trending in the direction of a buyer’s or seller’s market. We compare the pace of sales over the previous 12 months to determine how many Months’ Supply of Inventory is for sale. Generally, a balanced market would have between 6 to 7 months of inventory. At this time, all areas have 4 months of inventory or less and we remain in a Seller’s Market in the Bethany-Fenwick area.

Even with a serious winter storm that left us under snow for many weeks, we experienced good buyer activity at the beach during the first month of the year. In January, 17 properties went under contract in the

420 Views, 0 Comments
Read Full Post

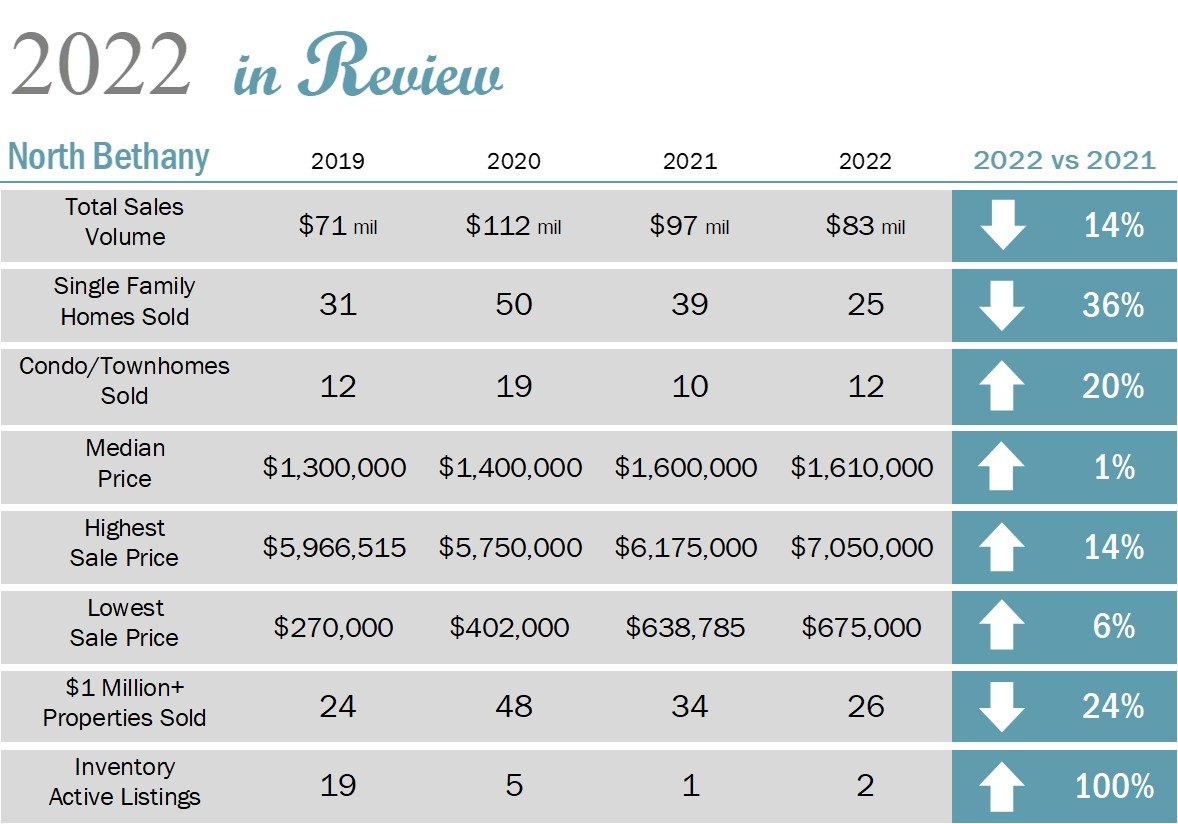
2024 North Bethany Real Estate Market Recap
*Data was derived from the Sussex County MLS & tax records. Includes properties sold in North Bethany. May not reflect all activity in the marketplace.

Happy New Year!  As we reflect on 2024, you might recall that throughout most of the year, real estate sales in North Bethany were much stronger when compared to 2023. Even as interest rates increased heading into the Summer season, inventory shortages kept values appreciating and sales remained high from January through October. Buyer activity slowed considerably in November and December, as anticipated, with the election and Holiday Season. 

We are optimistic and enthusiastic about the Delaware beach markets in the year ahead!  If you are considering a purchase or sale of North Bethany real estate,

663 Views, 0 Comments
Read Full Post

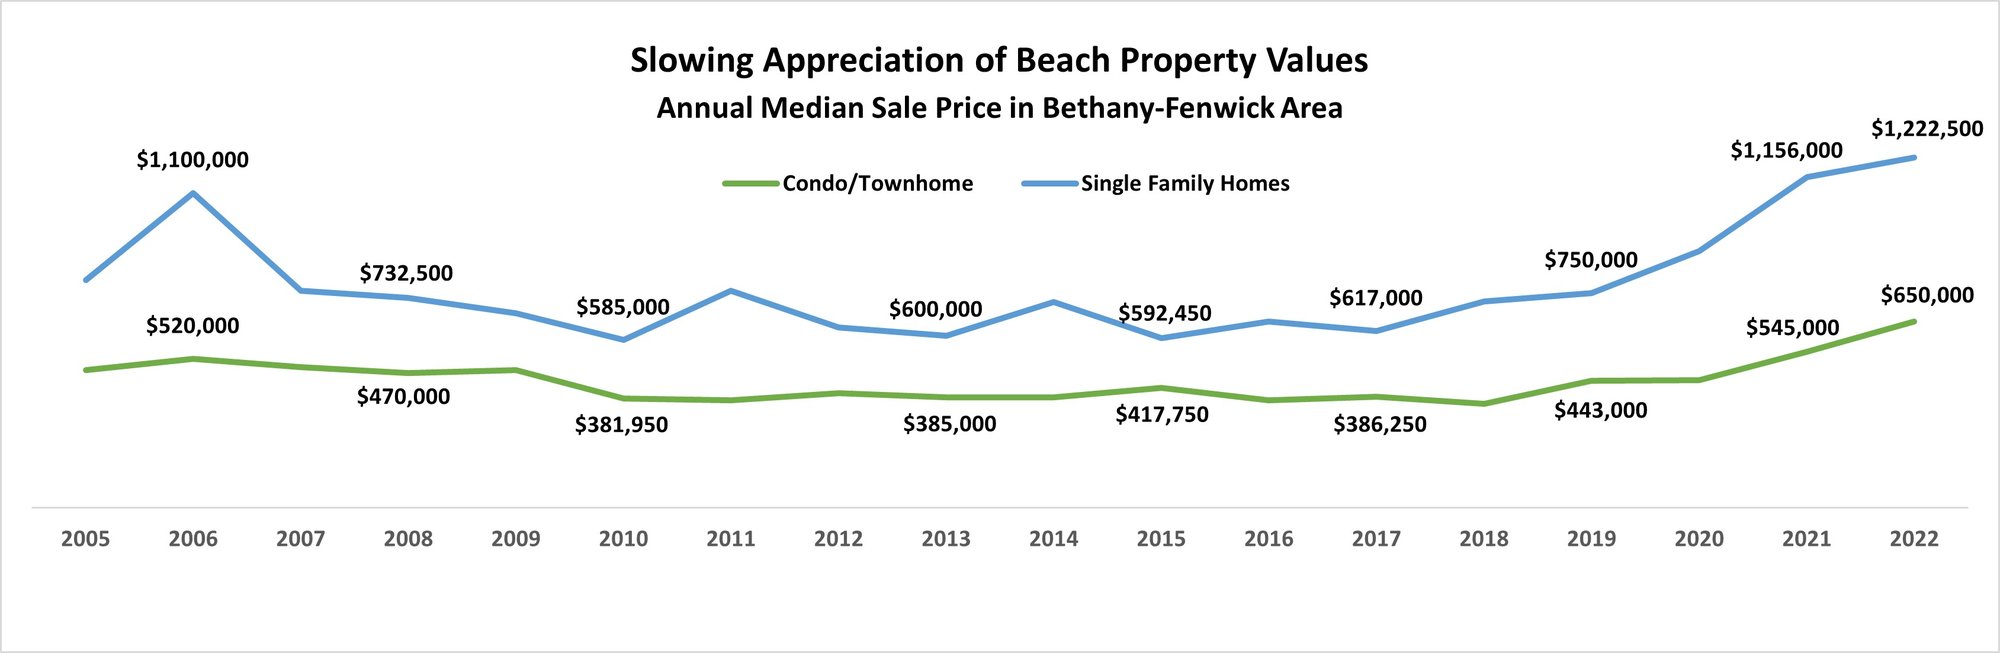
Last month, we shared with you that real estate sales had picked up in September. This carried into October as 34 properties in the Bethany-Fenwick area went under contract last month. This is up 55% compared to 22 sales in October of 2023. As the graph illustrates, the median sale price for both single family homes and condo/townhome properties have risen in 2024.   If you are considering a purchase or a sale, it is never too early to have a conversation. Please give us a call. During this time of Thanksgiving, we are grateful that so many of you look to our group for real estate guidance and expertise.   We wish you all a healthy and very joyful holiday!

Leslie Kopp                          Christi Arndt
(302) 542-3917                     (302)

562 Views, 0 Comments
Read Full Post

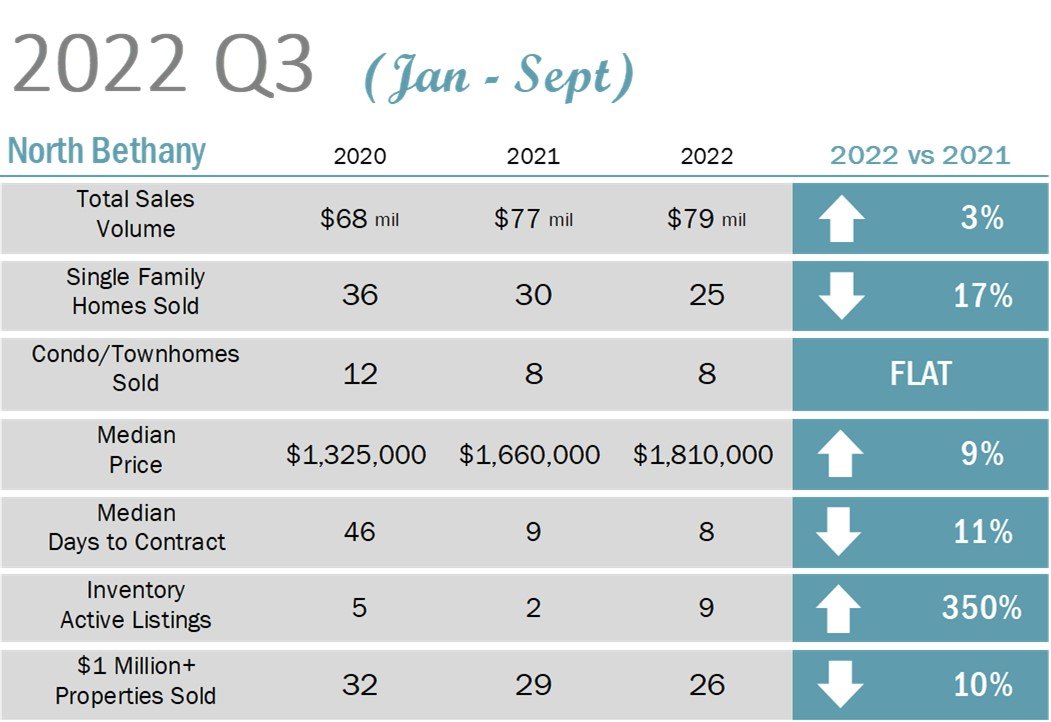
Last month, we reported that the beach real estate market slowed some in August. We are pleased to share that buyer activity picked up nicely in September ! During the month, 30 properties in the Bethany-Fenwick area went under contract. This is up 43% when compared to 21 sales during the same month last year.

A nice rise in newly available inventory, specifically for single family homes, was a leading factor that contributed to this flurry of activity. As the chart illustrates, through the first 3 quarters of the year, the market has remained firm for all property types at the beach. If you are exploring your options as a buyer or seller, we always welcome a conversation.

Leslie Kopp                          Christi Arndt                

542 Views, 0 Comments
Read Full Post