Delaware Beach Real Estate Blog - Fenwick Island Real Estate Blog

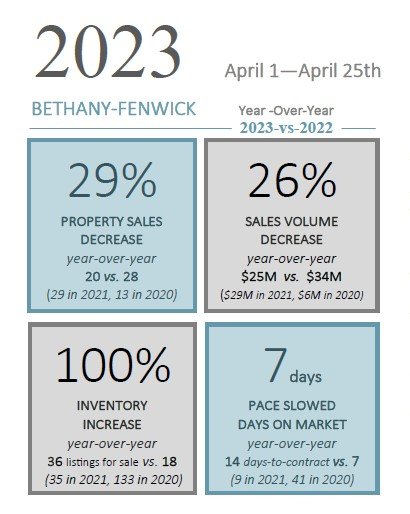
April is typically bustling with real estate activity ahead of the upcoming summer season, and this year has been no different!   So far this month, 20 properties have gone under contract in the Bethany-Fenwick area and nearly half of these properties went under contract in less than one week.
We are starting to see more opportunities with 39 listings currently for sale versus just 18 at this same time last year.  Below are a few very special properties that were recently listed for sale…. just in time for you to enjoy this summer at the beach!           

Please browse new listings below and give us a call to discuss these offerings or any others for sale: (302) 541-5207!

*Data was derived from the Sussex County MLS. Includes properties put…

953 Views, 0 Comments
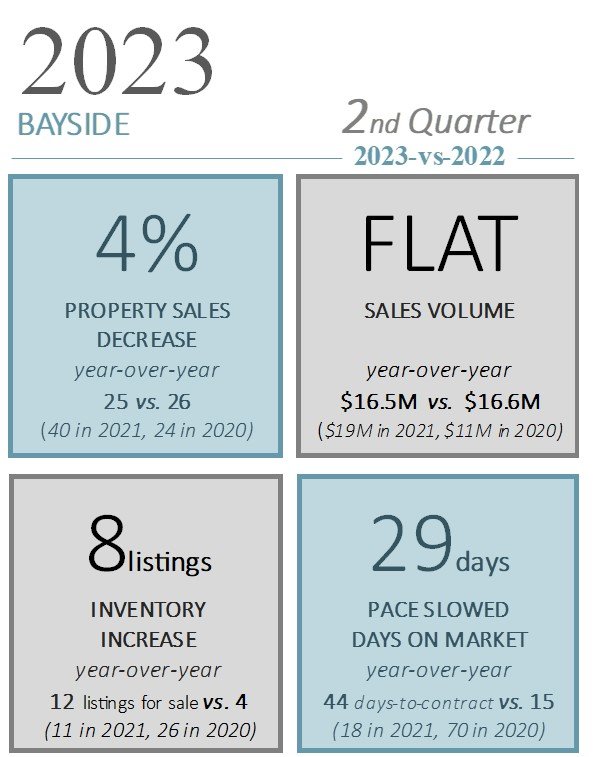
During the first quarter of the year, we continued to experience high buyer demand as we navigate historically low inventory .

As the chart illustrates, total sales were down 4% through the first quarter when compared to 2022 and sales volume was flat. The chart shows some slowing in the pace of sales as the average was 44 days-to-contract versus 15 days last year. The median sale price of single family homes in the first quarter was $1,300,000 vs. $910,000 in 2022 and for condo/townhome properties, $650,000 vs. $640,000.

If you are considering a sale or purchase, the experience and market knowledge of Wayne Lyons (302) 858-7347 and Kiki Hargrove (302) 569-2959 is unmatched. Please give them a call!

*Data was derived from the Sussex County…

877 Views, 0 Comments


During the first quarter of the year, we continued to experience a strong Seller’s market in the Bethany-Fenwick area as buyer demand remained high and we continued to navigate low inventory.

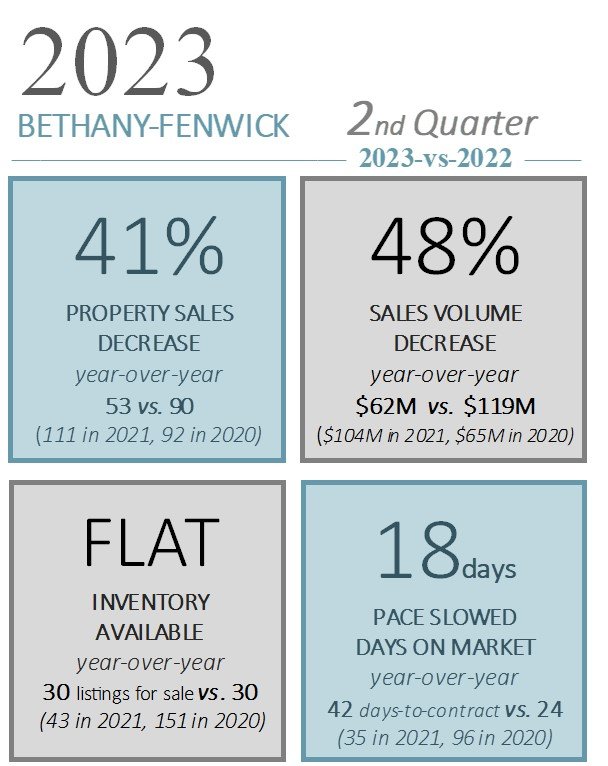
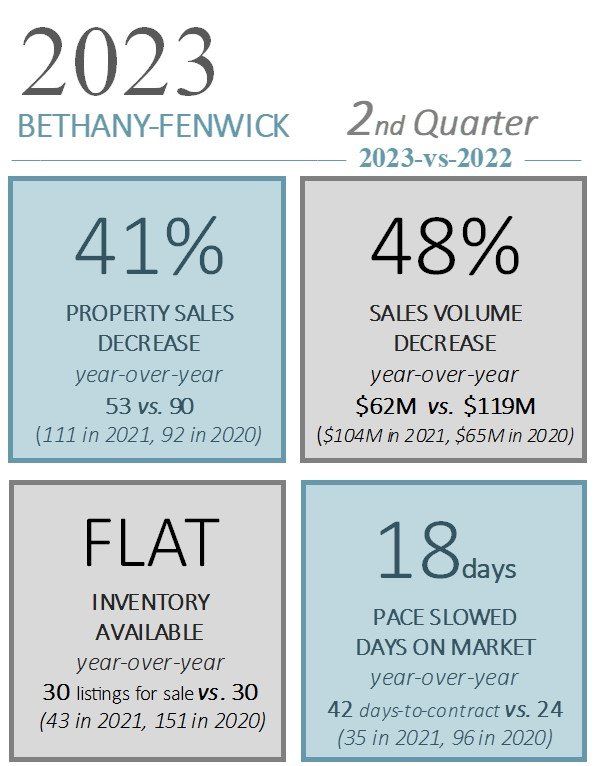
As the chart illustrates, total sales were down 41% when compared to last year while sales volume was down 48%. The chart shows some slowing in the pace of sales with the average days-to-contract at 42.  However, there was a noticeable increase in the pace of sales during the month of March. Property values are up 2% when compared to last year as the median sale price to-date is $870K vs. $850K in 2022. The upcoming summer season is a strong motivating factor for buyers to be more aggressive this time of the year and multiple offers are once again more…

996 Views, 0 Comments

During the first quarter of the year, we continued to experience a strong Seller’s market in the Bethany-Fenwick area as buyer demand remained high and we continued to navigate low inventory. 

As the chart illustrates, total sales were down 41% when compared to last year while sales volume was down 48%. The chart shows some slowing in the pace of sales with the average days-to-contract at 42.  However, there was a noticeable increase in the pace of sales during the month of March. Property values are up 2% when compared to last year as the median sale price to-date is $870K vs. $850K in 2022. The upcoming summer season is a strong motivating factor for buyers to be more aggressive this time of the year and multiple offers are once again more…

895 Views, 0 Comments

We are well into the month of March and it is hard to believe that we will soon welcome the first day of Spring! Light traffic and sun-filled days make it a beautiful time of the year to visit the beach.  

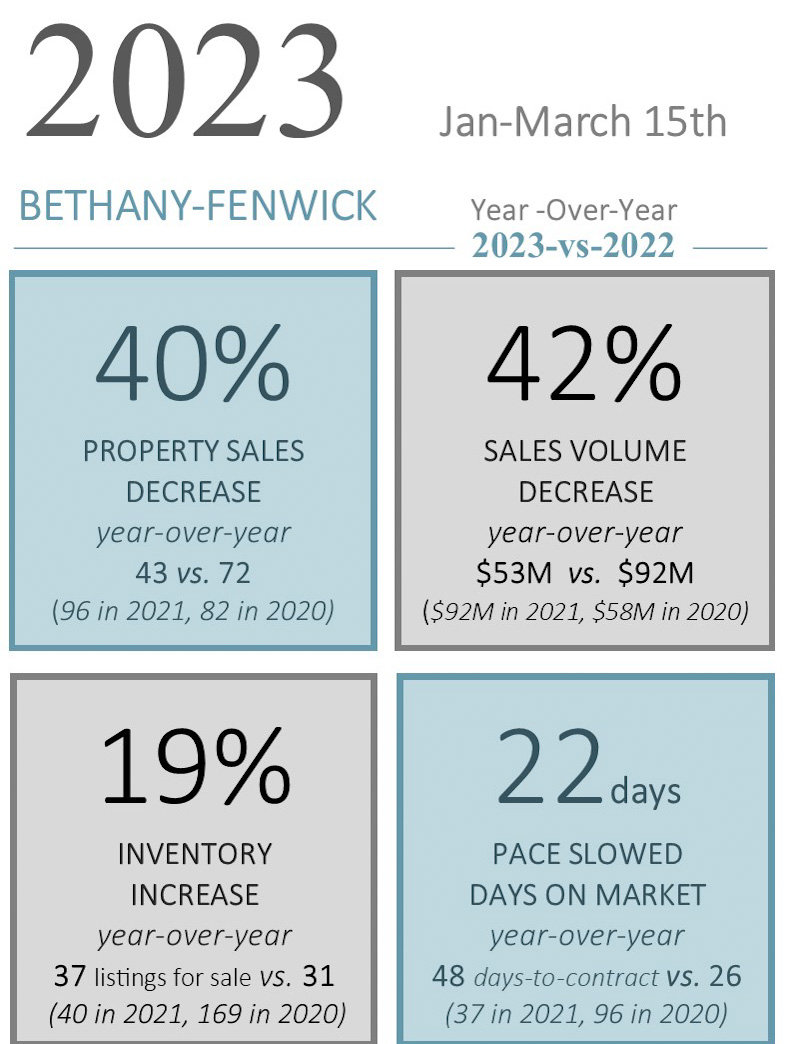
During the first 10 weeks of the year, we continued to experience a competitive market as buyer demand has remained high and we are still navigating low inventory. As the chart illustrates, total sales are down 40% when compared to last year while sales volume is down 42%. Property values have remained stable when compared to 2022 as the median price to-date is $865K vs. $850K in 2022.  

If you would like assistance finding a new beach home in time for this summer or listing your property for sale, we are here to help. Please give us a call…

1029 Views, 0 Comments

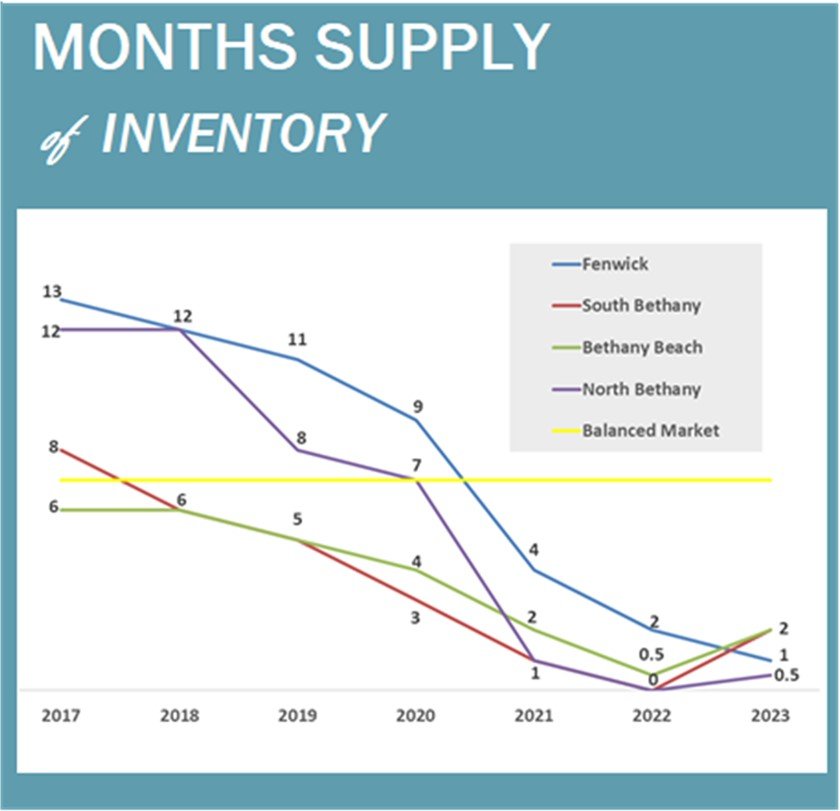
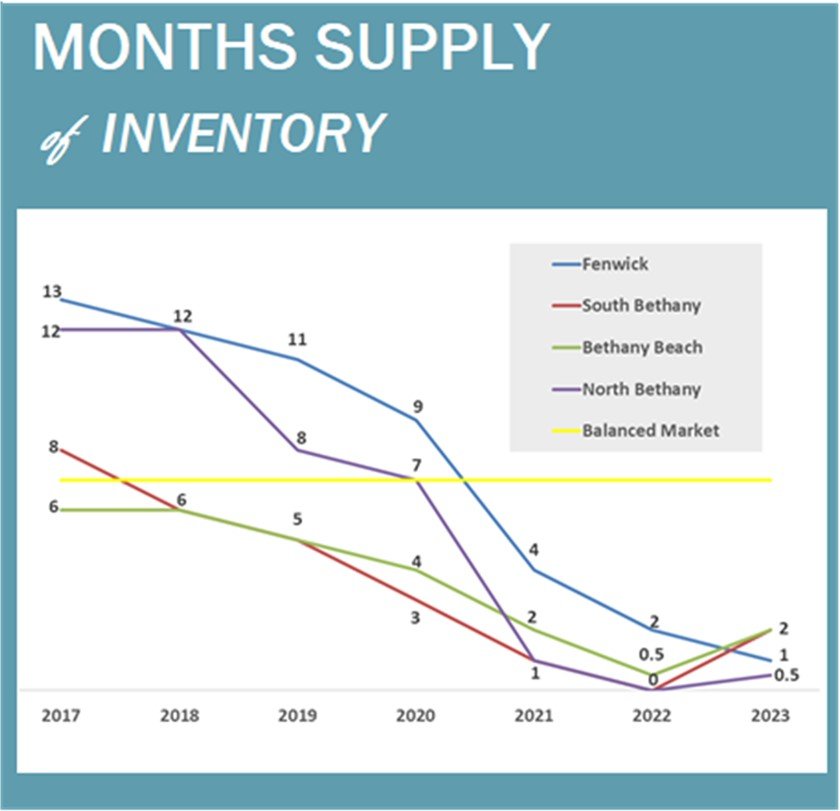
As we head into what is typically a strong selling season for beach property, this is a time we like to calculate absorption rates to determine whether we are trending in the direction of a buyer’s or seller’s market. We compare the pace of sales over the previous 12 months to determine how many Months Supply of Inventory is for sale. Generally, a balanced market would have between 6 to 7 months of inventory. At this time, all areas have 2 months of inventory or less. We are clearly still in a strong seller’s market in Fenwick Island due to inventory shortages, but as the chart illustrates, the trend is starting to change direction in most areas at the beach when compared to the same time last year.

This shift is a good representation of what we…

844 Views, 0 Comments

As we head into what is typically a strong selling season for beach property, this is a time we like to calculate absorption rates to determine whether we are trending in the direction of a buyer’s or seller’s market. We compare the pace of sales over the previous 12 months to determine how many Months Supply of Inventory is for sale. Generally, a balanced market would have between 6 to 7 months of inventory. At this time, all areas have 2 months of inventory or less. We are clearly still in a strong seller’s market due to inventory shortages, but as the chart illustrates, the trend has changed direction when compared to the same time last year.

This shift is a good representation of what we are currently experiencing in the marketplace. There is…

739 Views, 0 Comments

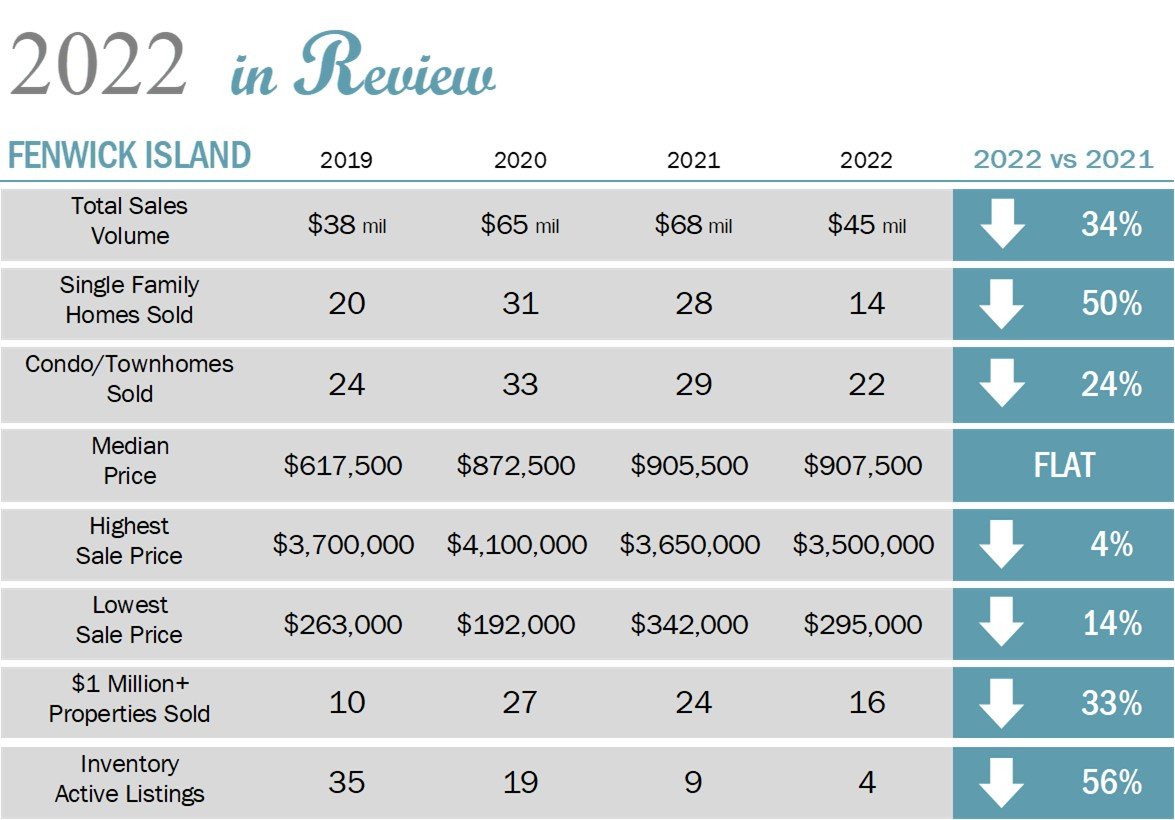
Happy New Year! As we reflect on 2022, you might recall that the surge in real estate activity we felt in 2020 and 2021 carried into the first quarter of 2022 and then slowed in the second quarter. There was moderate activity in the second half of the year. However, rising interest rates coupled with the continuation of low inventory contributed to a slowdown in both sales and appreciation later in the year. While there is still plenty of uncertainty about what the state of the economy means for real estate in the short term, we are enthusiastic about the year ahead!   

In 2022, we were fortunate to participate in 30% of sales in the Bethany-Fenwick area, representing the buyer, seller or both parties. Properties listed with our group sold faster…

918 Views, 0 Comments

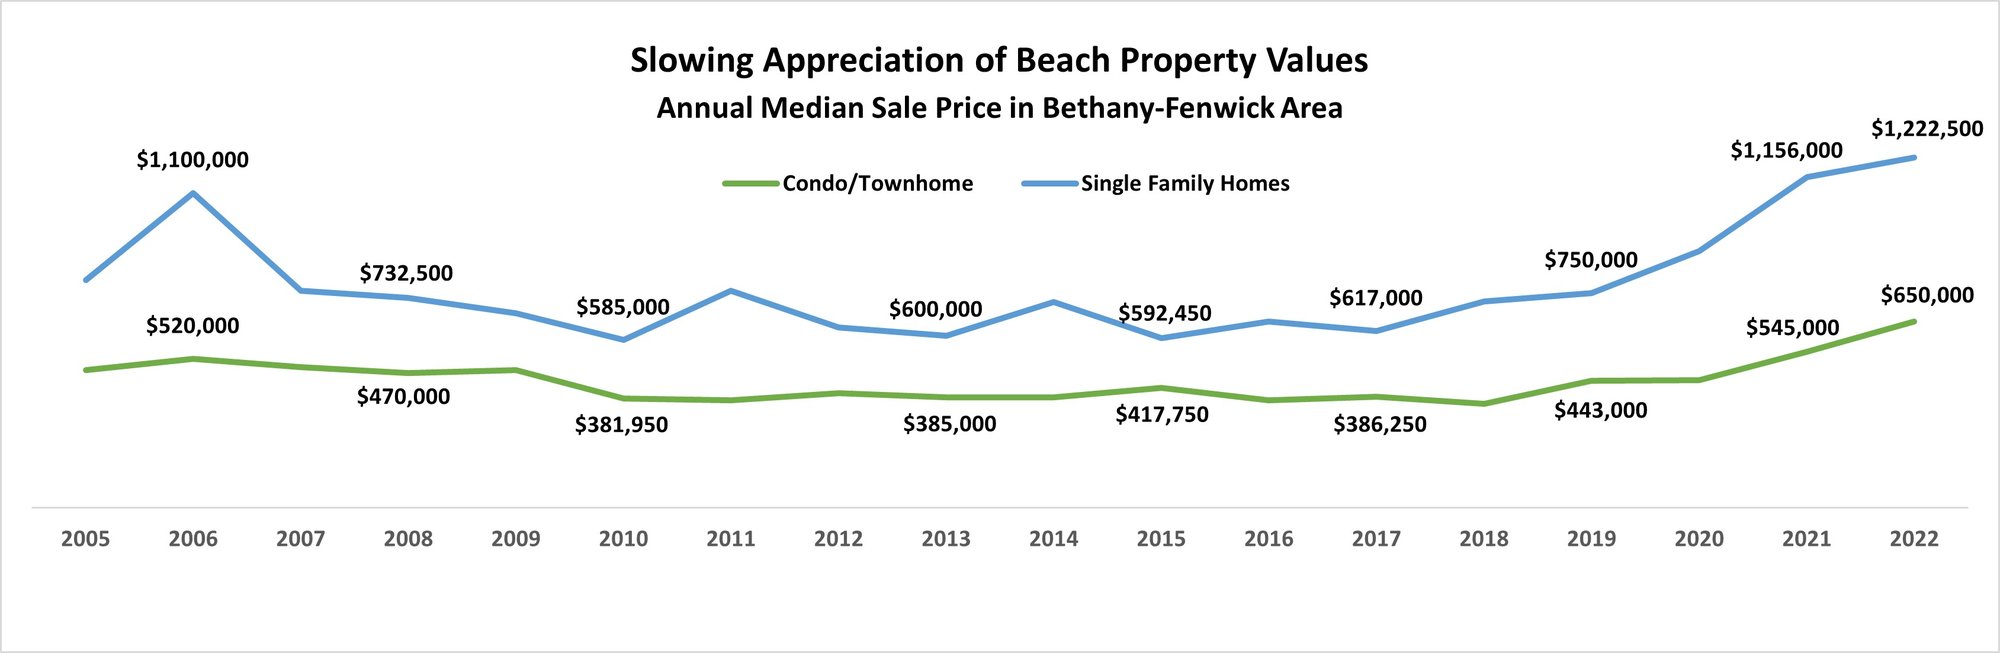
For the last few months, we have shared with you that the beach real estate market has been slowing, but as the graph illustrates, both single family homes and condo/townhome properties in the Bethany-Fenwick area continued to appreciate in value during 2022.

If you are considering a purchase or sale, we welcome a conversation to strategize about how to ensure the very best results in this shifting market!  

During this time of Thanksgiving, we are grateful for your continued confidence in our group. We all wish you and your loved ones a healthy and joyful holiday!


*Data was derived from the Sussex County MLS. Includes properties sold in Fenwick Island, South Bethany, Bethany Beach & North Bethany. May not reflect all activity in the…

896 Views, 0 Comments

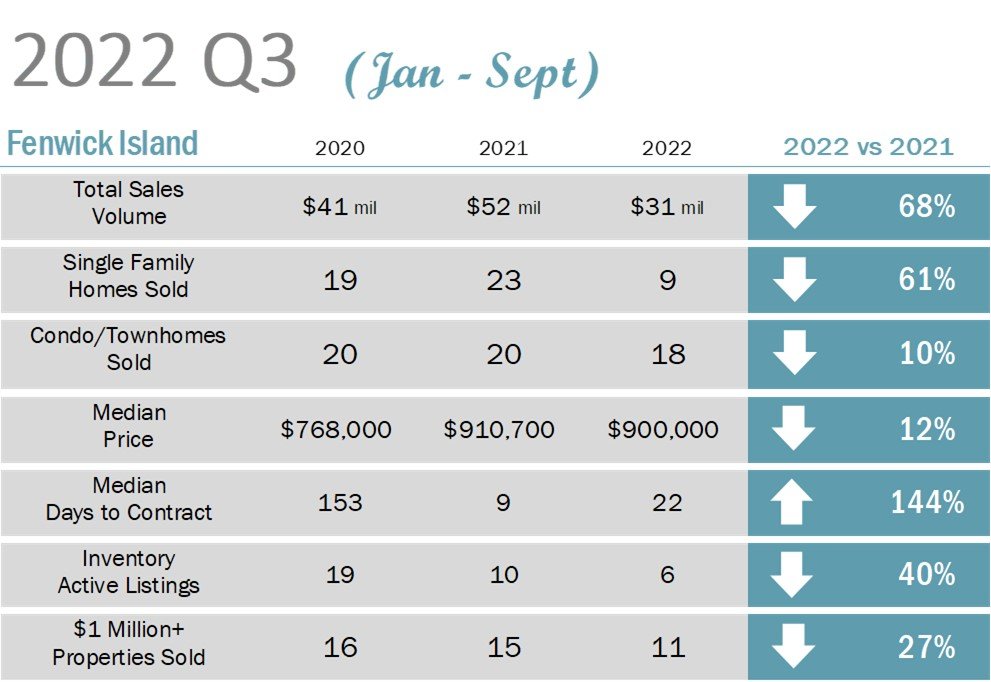
We all hear economic and financial data from multiple sources. At the end of the day, we feel it is important to share both the sales data in the chart provided and also some perspective on what we are experiencing first-hand.

As we reflect on the last 6 months or so, we started to notice a difference in the temperature of the market in the March/April timeframe. None-the-less, through a rising interest rate environment and uncertainty in the financial markets, we continued to see, and we are still seeing many properties sell very quickly. In September, 5 properties went under contract in Fenwick Island and 4 of the 5 went under contract in less than 1 week. These properties ranged in price from $370K to $3.6 million.

Given the state of the…

957 Views, 0 Comments